使用 Prometheus 收集 Docker 指标
Prometheus 是一个开源的系统监控和警报工具包。您可以将 Docker 配置为一个 Prometheus 目标。
警告可用的指标及其名称仍在积极开发中,并可能随时更改。
目前,您只能监控 Docker 本身。您当前无法使用 Docker 目标来监控您的应用程序。
示例
以下示例向您展示如何配置 Docker 守护进程,设置 Prometheus 作为容器在本地机器上运行,并使用 Prometheus 监控您的 Docker 实例。
配置守护进程
要将 Docker 守护进程配置为 Prometheus 目标,您需要在 daemon.json 配置文件中指定 metrics-address。默认情况下,守护进程期望该文件位于以下位置之一。如果文件不存在,请创建它。
- Linux:
/etc/docker/daemon.json - Windows Server:
C:\ProgramData\docker\config\daemon.json - Docker Desktop:打开 Docker Desktop 设置并选择 Docker Engine 来编辑文件。
添加以下配置
{
  "metrics-addr": "127.0.0.1:9323"
}
保存文件,或者对于 Docker Desktop for Mac 或 Docker Desktop for Windows,保存配置。重启 Docker。
Docker 现在通过环回接口在端口 9323 上暴露与 Prometheus 兼容的指标。您可以将其配置为使用通配符地址 0.0.0.0,但这会将 Prometheus 端口暴露给更广的网络。在决定哪个选项最适合您的环境时,请仔细考虑您的威胁模型。
创建一个 Prometheus 配置
复制以下配置文件并将其保存到您选择的位置,例如 /tmp/prometheus.yml。这是一个标准的 Prometheus 配置文件,只是在文件底部添加了 Docker 作业定义。
# my global config
global:
  scrape_interval: 15s # Set the scrape interval to every 15 seconds. Default is every 1 minute.
  evaluation_interval: 15s # Evaluate rules every 15 seconds. The default is every 1 minute.
  # scrape_timeout is set to the global default (10s).

  # Attach these labels to any time series or alerts when communicating with
  # external systems (federation, remote storage, Alertmanager).
  external_labels:
    monitor: "codelab-monitor"

# Load rules once and periodically evaluate them according to the global 'evaluation_interval'.
rule_files:
  # - "first.rules"
  # - "second.rules"

# A scrape configuration containing exactly one endpoint to scrape:
# Here it's Prometheus itself.
scrape_configs:
  # The job name is added as a label `job=<job_name>` to any timeseries scraped from this config.
  - job_name: prometheus

    # metrics_path defaults to '/metrics'
    # scheme defaults to 'http'.

    static_configs:
      - targets: ["localhost:9090"]

  - job_name: docker
      # metrics_path defaults to '/metrics'
      # scheme defaults to 'http'.

    static_configs:
      - targets: ["host.docker.internal:9323"]
在容器中运行 Prometheus
接下来,使用此配置启动一个 Prometheus 容器。
$ docker run --name my-prometheus \
    --mount type=bind,source=/tmp/prometheus.yml,destination=/etc/prometheus/prometheus.yml \
    -p 9090:9090 \
    --add-host host.docker.internal=host-gateway \
    prom/prometheus
如果您使用的是 Docker Desktop,--add-host 标志是可选的。此标志确保主机的内部 IP 暴露给 Prometheus 容器。Docker Desktop 默认会这样做。主机 IP 以 host.docker.internal 主机名的形式暴露。这与上一步在 prometheus.yml 中定义的配置相匹配。
打开 Prometheus 仪表盘
验证 Docker 目标已列在 https://:9090/targets/。
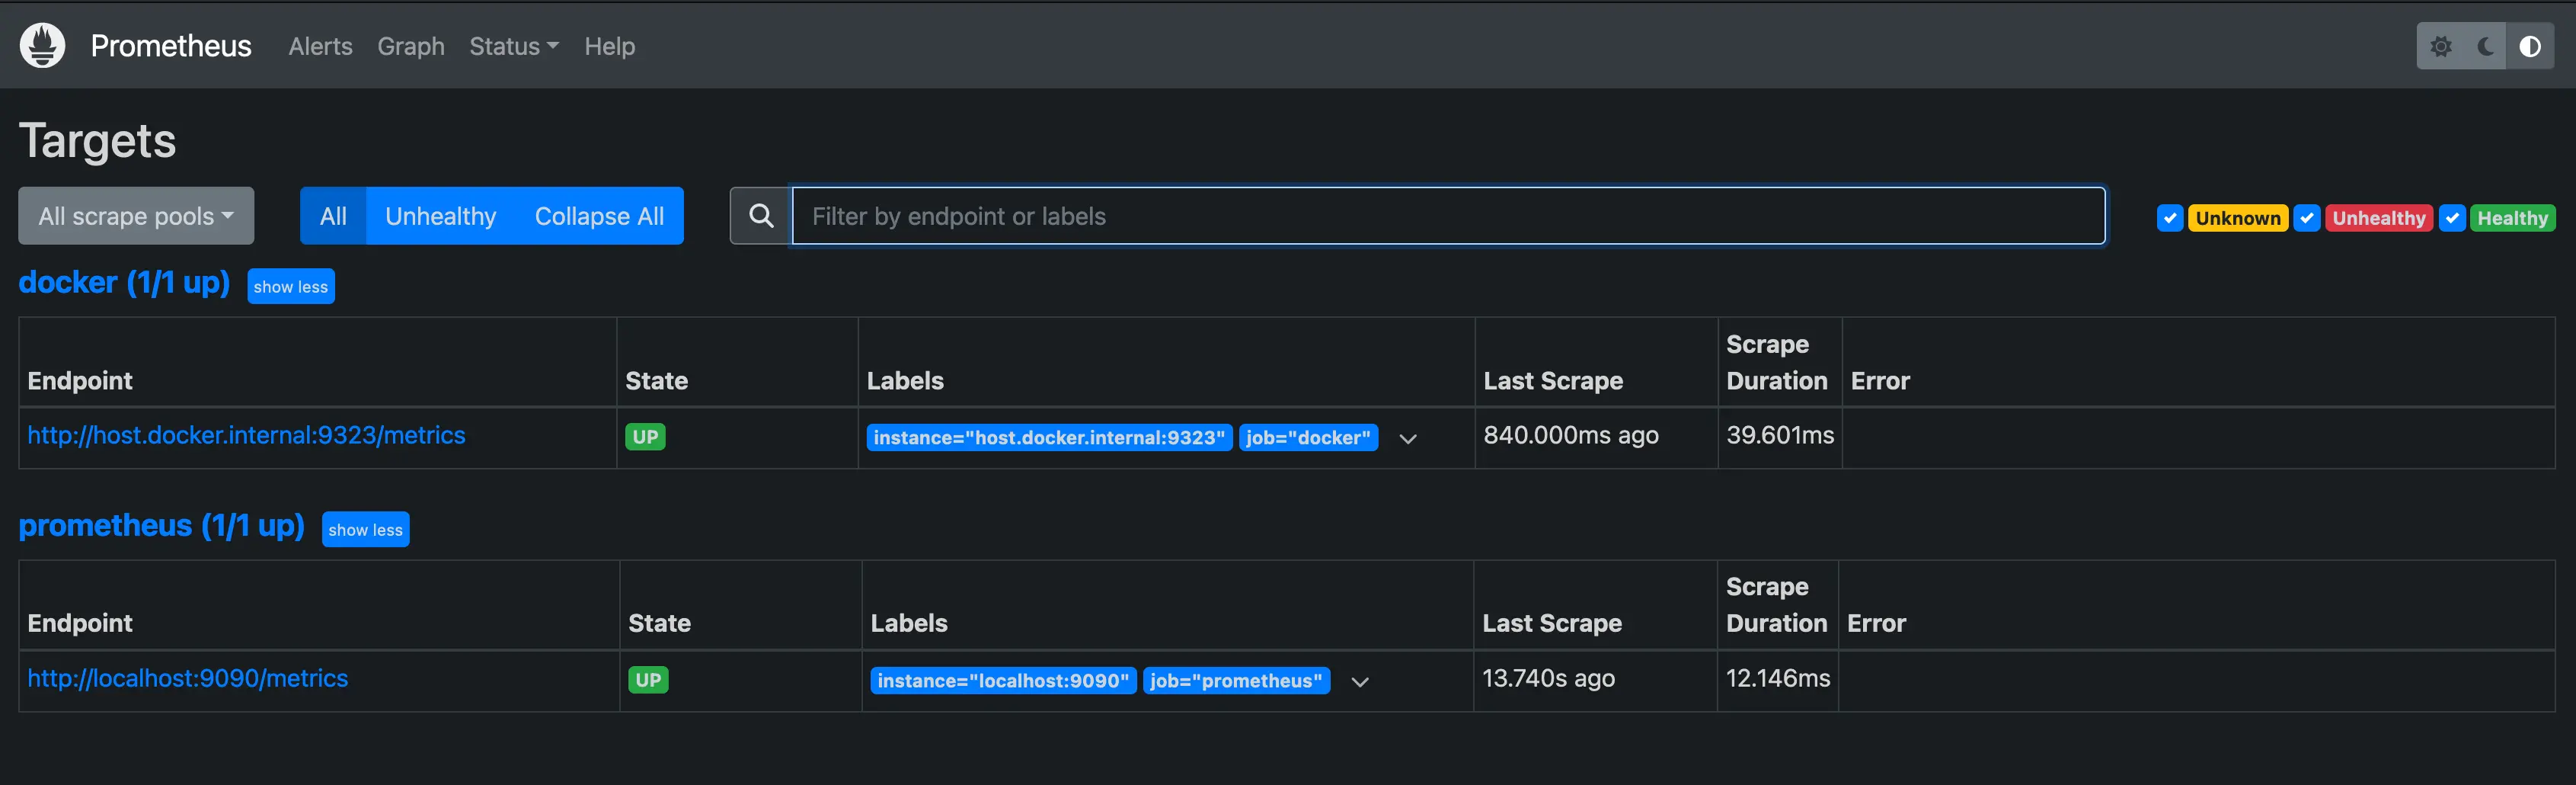
注意如果您使用 Docker Desktop,您无法直接访问此页面上的端点 URL。
使用 Prometheus
创建一个图表。在 Prometheus UI 中选择 Graphs 链接。从 Execute 按钮右侧的组合框中选择一个指标,然后单击 Execute。下面的屏幕截图显示了 engine_daemon_network_actions_seconds_count 的图表。
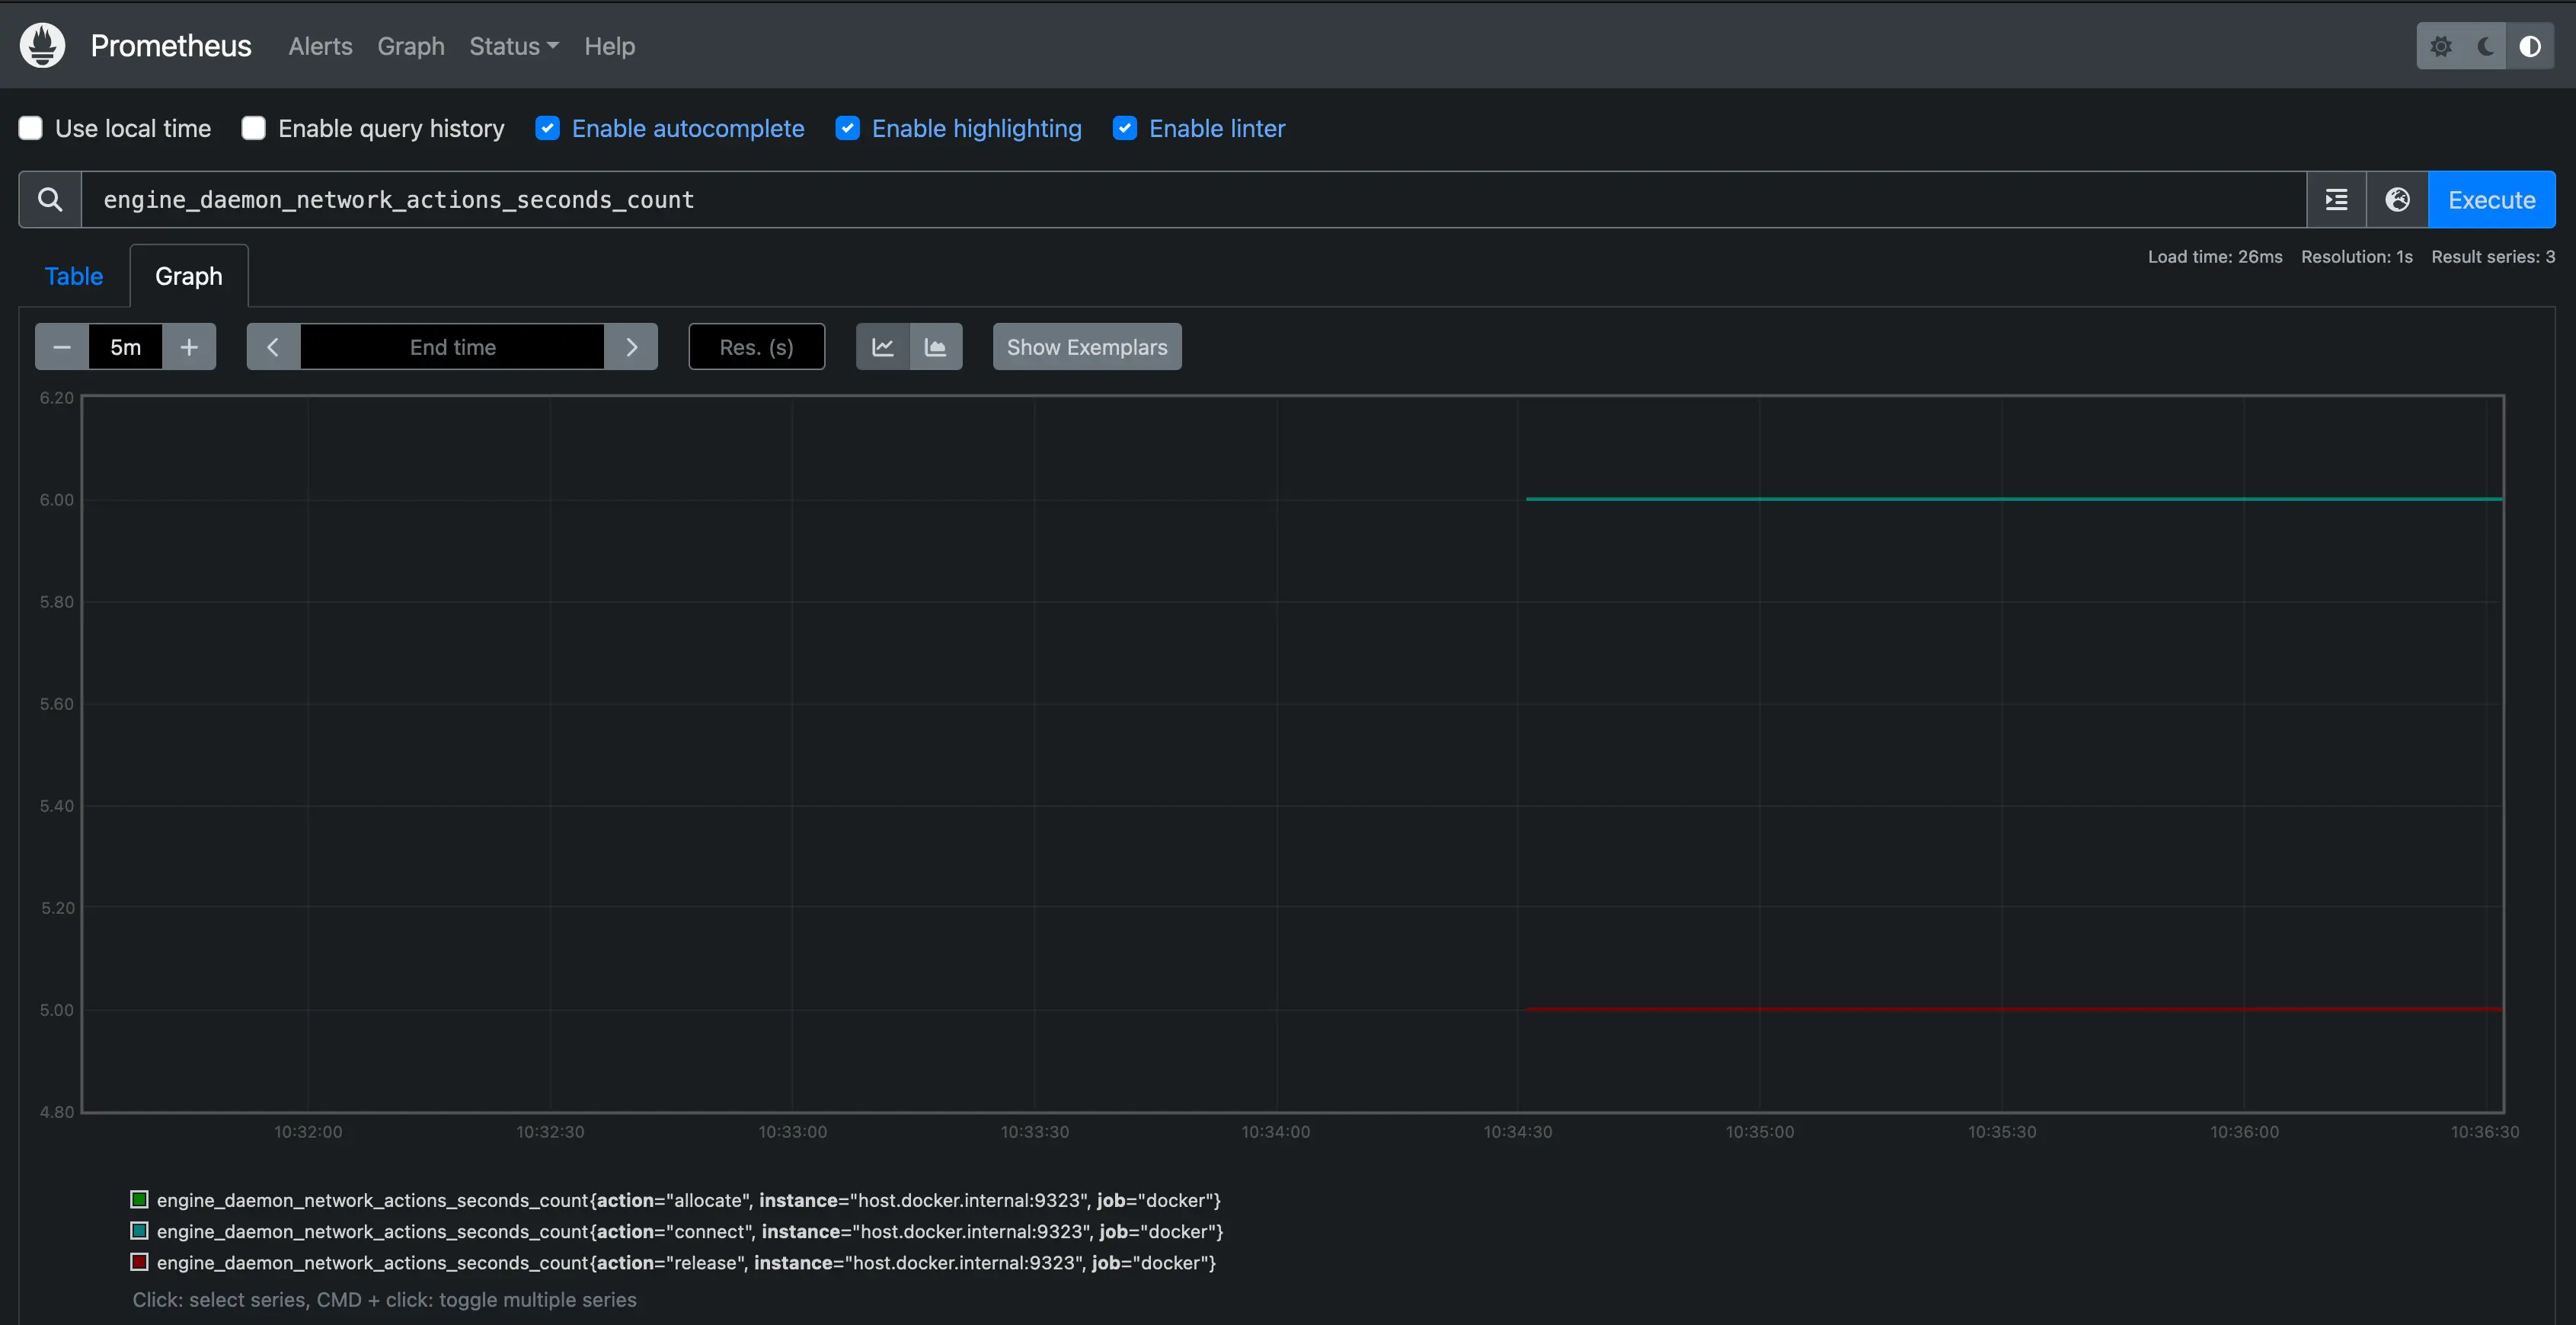
该图表显示了一个相当空闲的 Docker 实例,除非您已经在系统上运行了活动的工作负载。
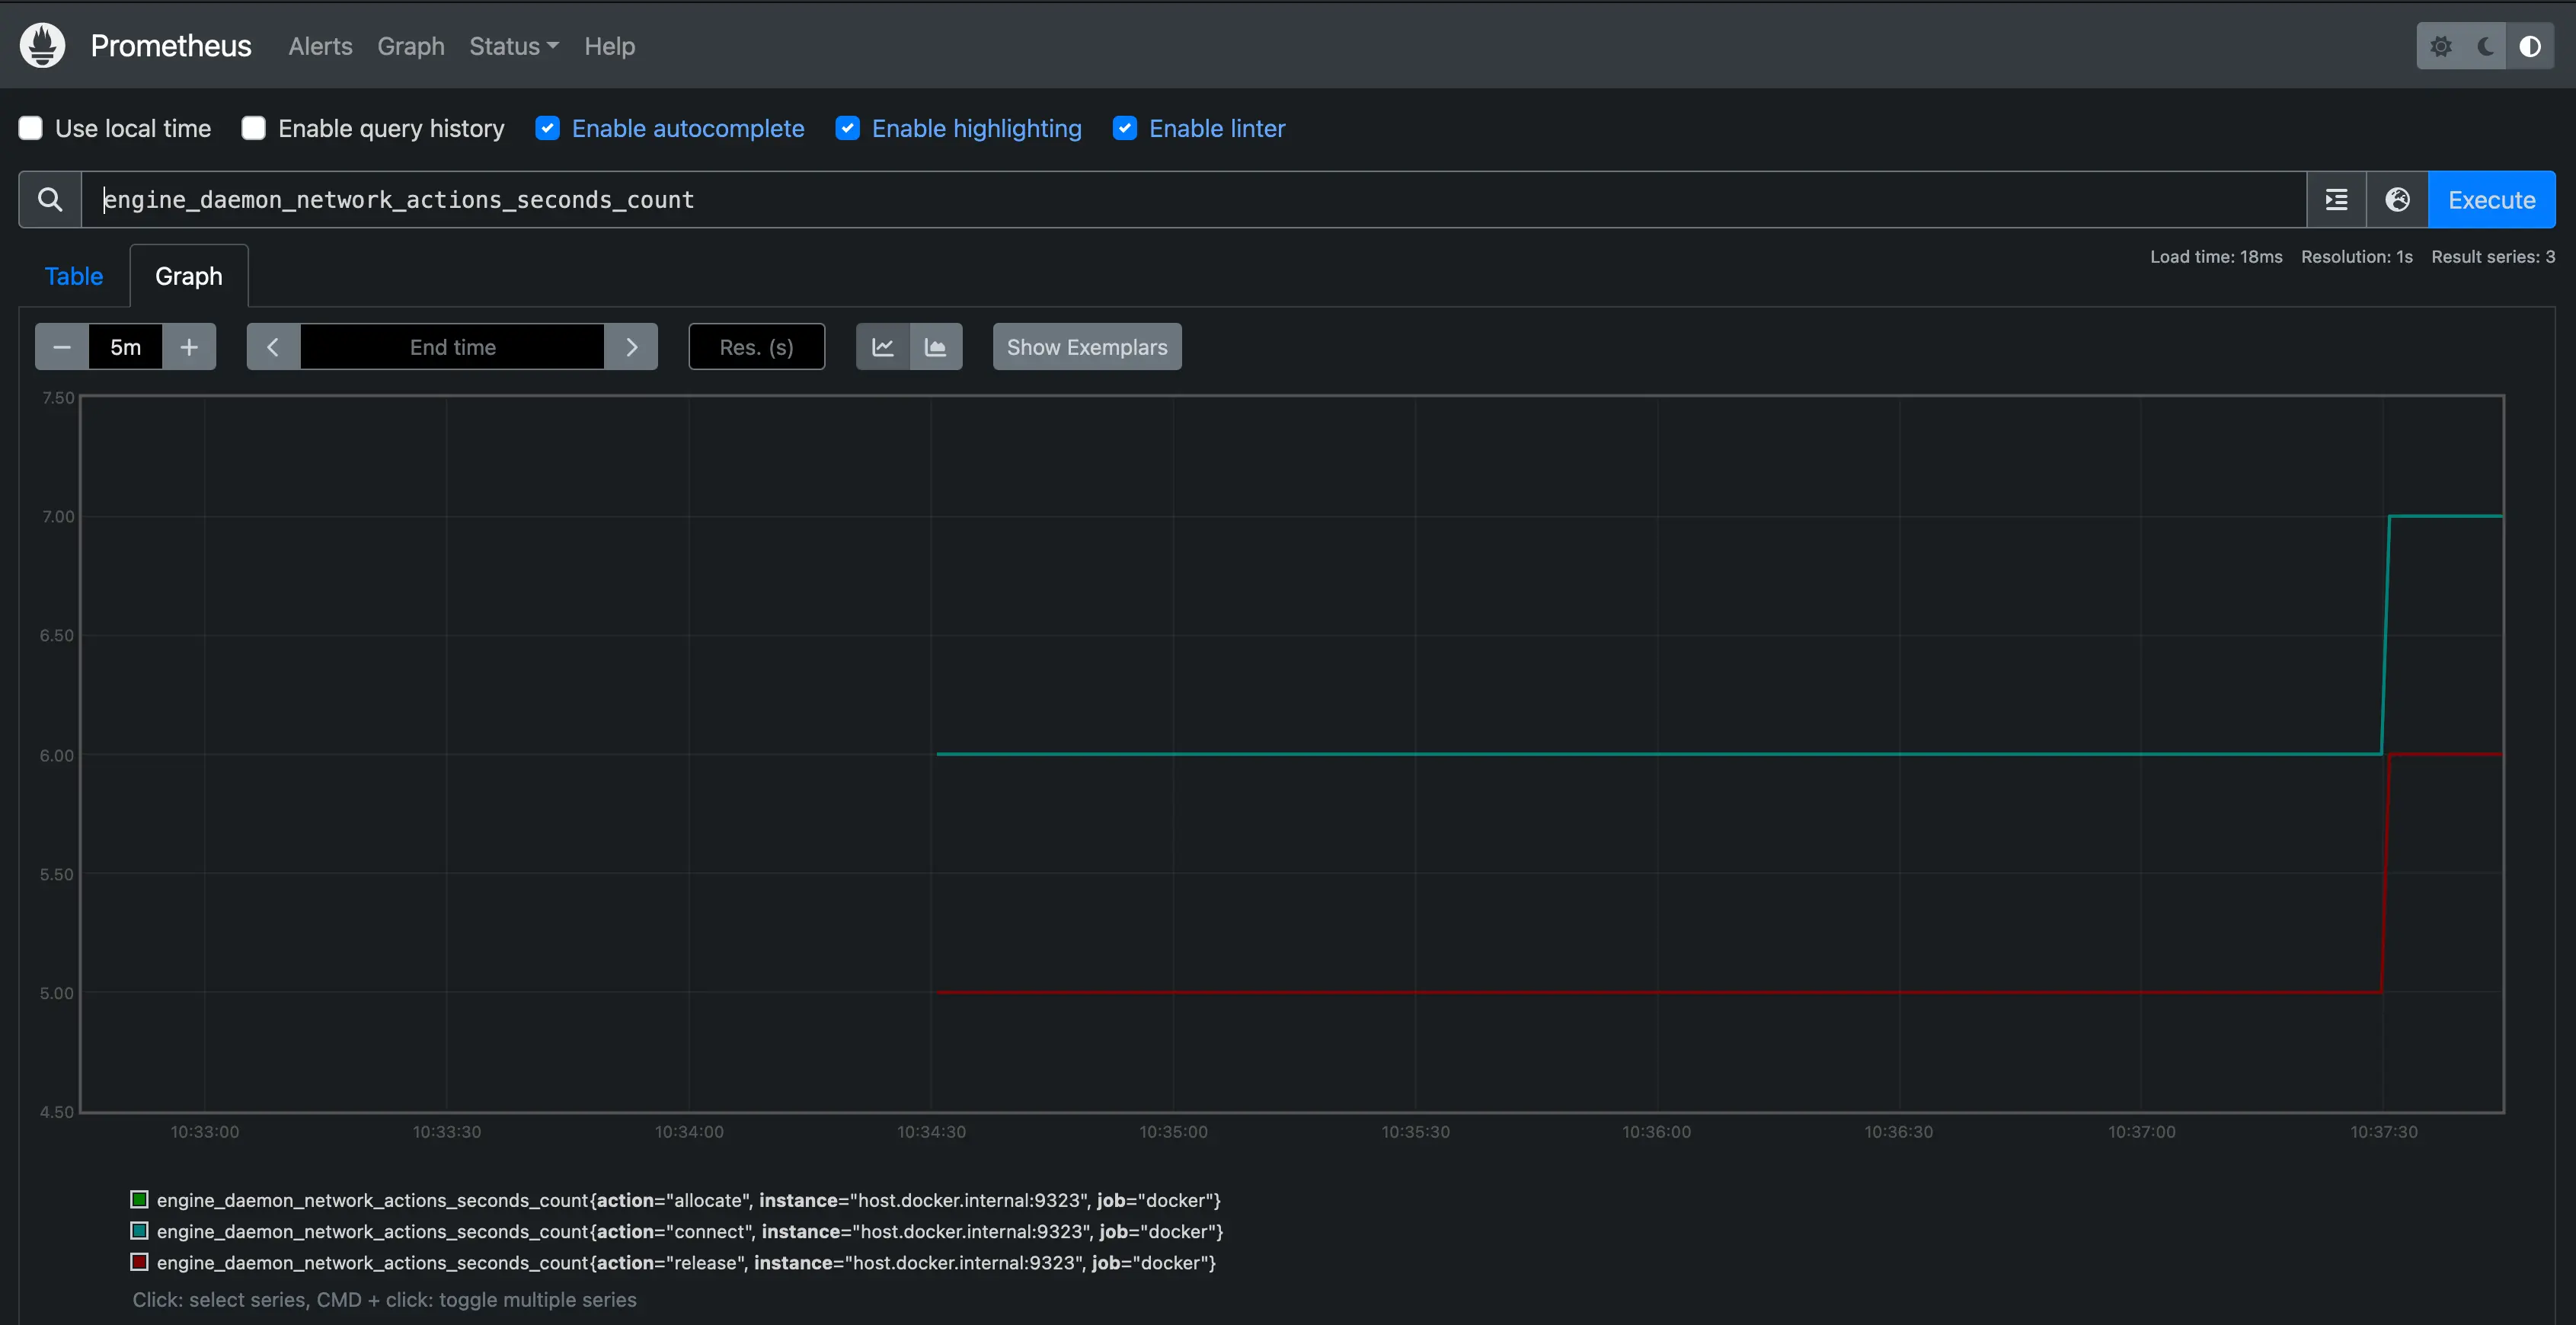
为了让图表更有趣,运行一个使用网络操作的容器,方法是启动一个包管理器来下载一些包
$ docker run --rm alpine apk add git make musl-dev go
等待几秒钟(默认抓取间隔为 15 秒)并重新加载您的图表。您应该会看到图表出现上升,显示了您刚才运行的容器引起的网络流量增加。
后续步骤
这里提供的示例展示了如何将 Prometheus 作为容器在本地系统上运行。在实践中,您可能会在另一台系统上运行 Prometheus,或者作为云服务运行在某个地方。在这种情况下,您也可以将 Docker 守护进程设置为 Prometheus 目标。配置守护进程的 metrics-addr 并在您的 Prometheus 配置中将守护进程的地址添加为抓取端点。
- job_name: docker
  static_configs:
    - targets: ["docker.daemon.example:<PORT>"]
有关 Prometheus 的更多信息,请参阅 Prometheus 文档